GPS Speed Plot
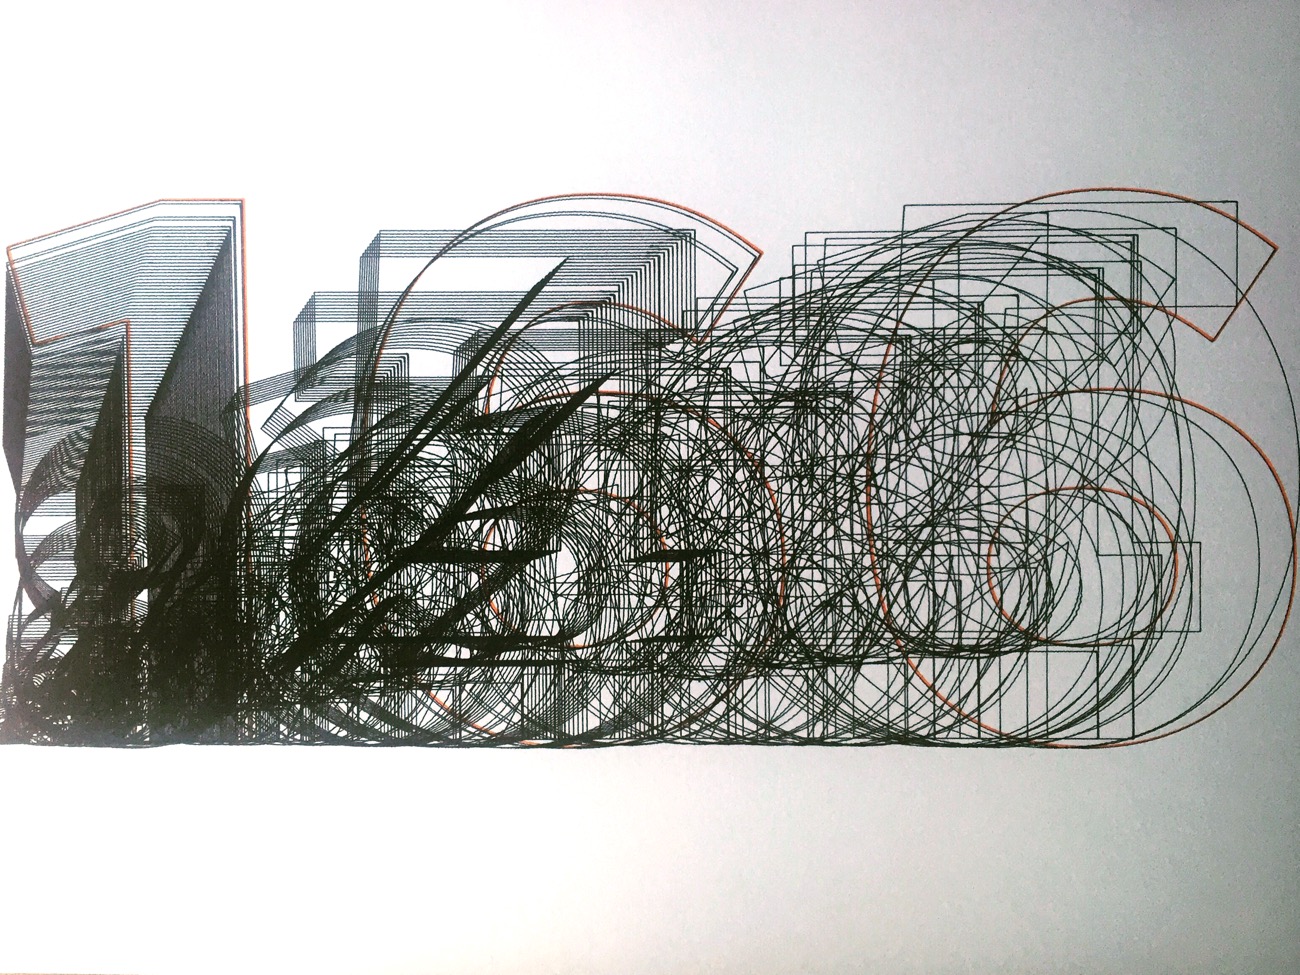
A Typographic Plot of GPS Data
Getting a new tool to use in the studio always brings new ways to execute an idea, were the medium becomes part of the work. Recently I took delivery of an AxiDraw plotter from Evil Mad Scientist and I've been exploring what I can do with it.
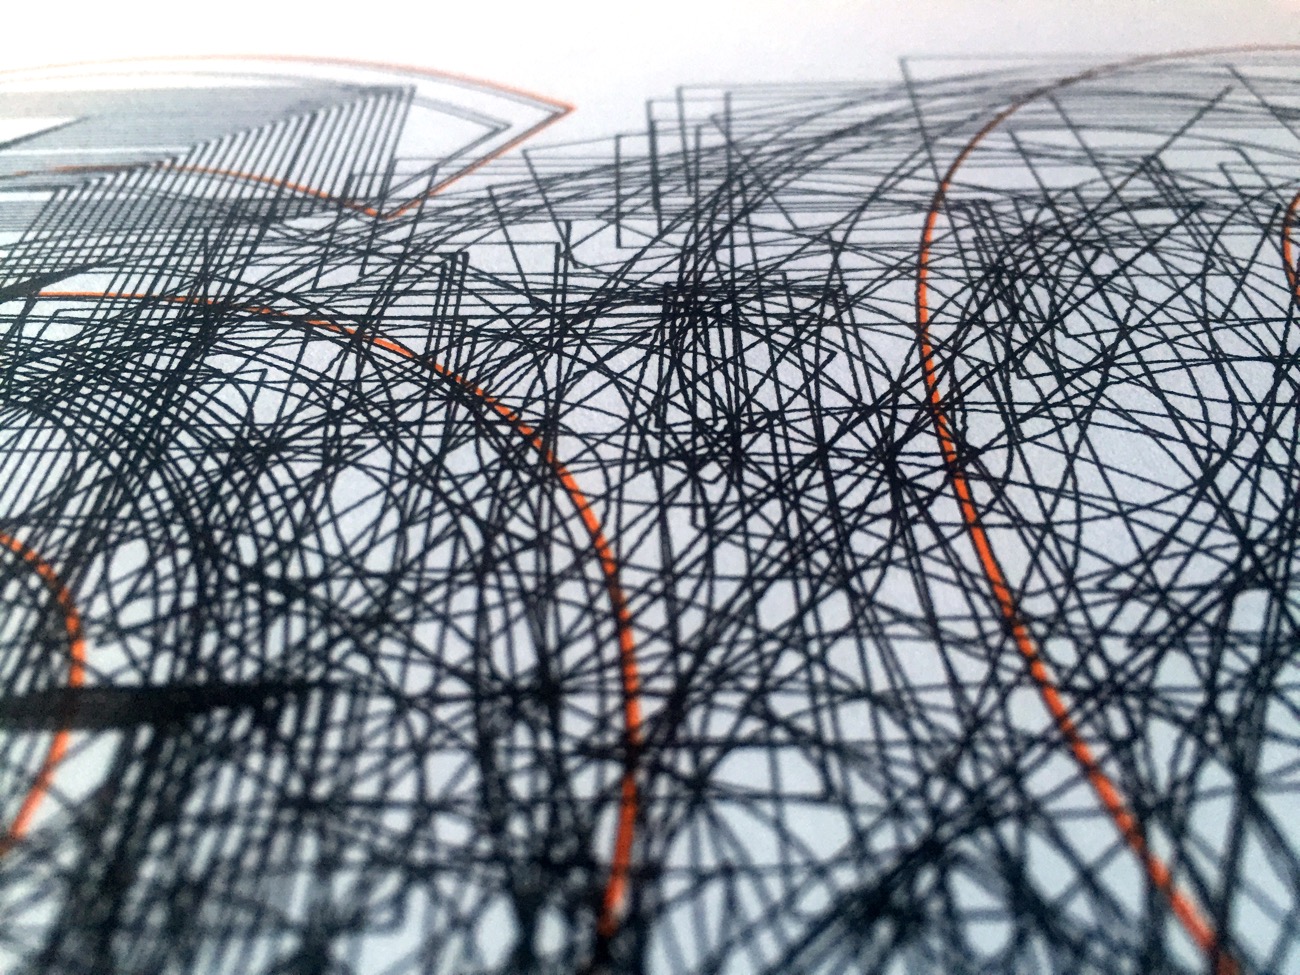
One of the things I did was take my brother-in-law Philip's GPS data from his annual drive from France and created a typographic expression of his speed, with larger speeds being represented by larger numbers. What I like about this is the density of ink that is built up amongst the more average speeds to the lower left of the image. A usual printing process would simply print this in one pass yet with a plotter these layers of numbers are built up over time, creating a greater density of ink. Meanwhile the more unique numbers — the higher speeds — are less dense and are easier to make out. The whole piece in the end conveys a feeling of speed / motion.


Created in 2016
Other “Dawesome” Things


Sign-up for the Dawesome Digest
Get in touch to talk about working together